Battery Ageing Model

Kia Soul EV Forum

Help Support Kia Soul EV Forum:

This site may earn a commission from merchant affiliate links, including eBay, Amazon, and others.

JejuSoul

Moderator
Staff member
Joined
Jul 8, 2015
Messages
1,940
Location
Jeju
I have been looking at the Battery Ageing Model for the Nissan 1eaf - http://www.electricvehiclewiki.com/?title=Battery_Capacity_Loss
And wondering what data we need to collect from our cars to create such a model.

For the Nissan this list is sufficient
City: Choose a nearby city from an existing list in the spreadsheet.
Miles/kWh: Estimate your 1EAF driving efficiency. If you do not know, 4.0 is a good starting estimate.
Days/week in the Sun: How many days per week will the 1EAF be parked in the sun, on average?
Estimated Annual Mileage: How many miles do you expect to drive the 1EAF each year?

The most important for the Nissan is the location. The Nissan cannot cope with hot climates.

We have very little data so far for the Soul EV, but so far it does not look at all like the 1eaf
I am interested in knowing what data we need to collect, and how we graph that data.
The current dataset is too small to allow us to know when or whether the battery warranty date would be reached.
The following graph uses data from 3 different cars. (One in South Korea, one in Sweden, one in Canada)
It plots the number of discharge cycles against battery deterioration.
This data is read from the OBD - On Board Diagnostic device.
1z5rsbq.jpg

If these lines are valid, then what explains the huge difference in slope. It doesn't seem to be any of the four factors effecting the 1eaf. We would need more data to make a better guess.
 
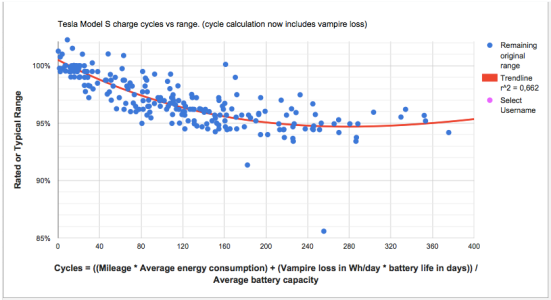
Looking for data for the T esla - I found this site: https://steinbuch.wordpress.com/2015/01/24/tesla-model-s-battery-degradation-data/

One of the images showing battery degradation is
4-battery.png

Ignore the trendline, the author states that is just an automatic artefact of his graphing software. What is interesting is the complexity of the equation to get the number of cycles.

In my graph at top I have used a really simple technique to get the number of cycles, just divide the Cumulative Discharge by the Pack Size. This is only easy when the Pack Size is fixed. It is at the moment - all cars in our sample have a usable Pack Size of 27kWh. But when we start to get actual deterioration of range then we need to find a different way. This means collecting different data, possibly range testing - anyone got any good ideas?
 
I think it could be more direct to focus on the actual energy passed to/from the battery, relative to used SOC. By computing a "virtual SOH" value every week or workday I hope any hidden pattern will show up. We have enough knowledge about the BMS info by now. My suggestion is:

Use an OBD2 reader to get the following info:
- SOC(t) (Total SOC for battery)
- SOC(d) (Displayed SOC)
- CCE (Cumulative Charge Energy)
- CDE (Cumulative Discharge Energy)

Use two samples and compute:
Used energy E = (CDE2-CDE1) - (CCE2-CCE1)
SOH(t) = E / (SOC(t) diff) / Total Capacity (30kWh)
SOH(d) = E / (SOC(d) diff) / Official Capacity (27kWh)

The main benefit is that no range- or energy consumption parameters will matter.

I already have 5 days statistics ;) based on my 100km commute:

Mon: SOC=54/58 E=15.6kWh => SOH=96.3/99.6
Tue: SOC=54/58 E=15.3kWh => SOH=94.4/97.7
Wed: SOC=54.5/58.5 E=15.4kWh => SOH=94.2/97.5
Thu: SOC=56/60 E=16.4kWh => SOH=97.6/101.2
Fri: SOC=55/59 E=16.4kWh => SOH=99.4/103.0

Over time we should see battery deterioration reflected in these values, and also if the BMS has any compensation built in for the displayed SOC.
This may already be seen in this limited data; If I use 29 kWh for total capacity instead of 30 kWh, the SOH values are very close to each other, so maybe my battery has lost 1 kWh, but I can still use 27.
 
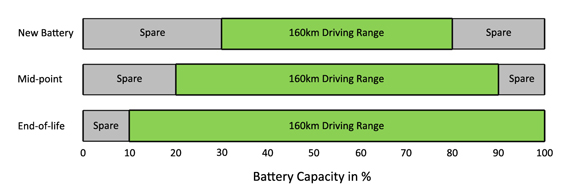
Elmil: Your method seems to have the same the same problem as mine. We do not know what the current Total Capacity and current Usable Capacity actually are. The original Total Capacity is actually 30.4kWh according to data here http://avt.inel.gov/fsev.shtml. The current Usable Capacity will only match the Official Capacity or what I would call the original Usable Capacity for the first year or so. Initially only the Total Capacity will fall, but later both will do so.
There is an image from the Battery University site that helps explain this - http://www.batteryuniversity.com/_img/content/ev-driving-range-web.jpg
ev-driving-range-web.jpg

Although the image is misleading in labelling the last row End-of-life. That row actually represents the point at which Usable Capacity will begin to decrease.

Anyway for now I will continue collecting and displaying data that compares total battery deterioration against number of discharge cycles. This only works when Usable Capacity is fixed. So I am only using it to give an estimate of when we reach the point Usable Capacity begins to decrease. For now none of the cars here (the 9 I have data for) have reached that point. This graph shows one point for each car using the latest data available for that car.

3509nog.jpg
 
JejuSoul:I have more data for you..
This week I had another change (upwards) in the deterioration values during nightly charging. It happened 14 days and almost 1000km after previous change. They are now at 10.3/9.2%.
Last two weeks have been chilly (-4 to +4C) so I have started with 100% displayed SOC every morning, and after 100km commute there has been 38-42% left, i.e around 60% consumed. One deviation, though: On wednesday I decided to start with 80%, just to see the behaviour during cold weather when SOC gets down towards 20%. And expected it did. But when I compared the logged data from that trip with the other days, I noticed that the Accumulated energy counters indicate 14.1 kWh consumed during 80-20% SOC while days where I used 100-40% the energy count was around 16 kWh. And, of course, no charging at work..

It seems like this is an indication of hitting the 'knee' at the lower end of the discharge graph, where voltage is falling more steep and the BMS gets out of linear calculation. It's also well known that battery cells 'shrink' in low temperature, so the knee will happen earlier. On the other hand I need to repeat the 80% trip to see if it's consistent.

Interesting is that my deterioration counters were updated during charging after that trip. Maybe the BMS noticed the deviation and made the adjustion because of it?
 
Elmil: thanks for the update.
Could you post the CAN data. I can update the graph.

I do not fully understand the Cumulative Energy counters.
They do not seem to match what I put in or use. Here's an example.
On Nov 11th I did a lengthy test drive charging the car before and after.
I took readings at home, a 30 min drive from where I started and finished the 215km round-the-island-on-one-charge-trip.
Total driving for the day was 273km, which took 7.5 hours.
Charging time for two L3 charges and one L2 was 2 hours.
According to the data the Operating Time was 9.7 hours.
Clearly the Cumulative Operating Time data includes the time spent charging.
The readings on the charging machines from the 3 charging sessions suggest I added 35kWh.
Using the reading on the car's display 8 km/kWh suggests I used 34kWh for the trip.
SOC at start = 56%, SOC at end = 62% which is why I charged more than I used.
The Cumulative Energy Charged data increased by 50kWh
The Cumulative Energy Discharged data increased by 48kWh
What is the reason for this disparity 35 / 34 contrasted with 50 / 48
 
Here's the data from the moment the deterioration values were updated.
Odometer reading was 19751 km

2015-11-19 04:44:00
2101
7EC 10 3D 61 01 FF FF FF FF
7EC 21 AE 17 DD 23 28 A3 FF
7EC 22 DE 0F 55 0E 0C 0E 0C
7EC 23 0C 0B 0B 00 0F CC 2A
7EC 24 CC 53 00 00 82 00 01
7EC 25 65 92 00 01 60 D6 00
7EC 26 00 83 B6 00 00 7E A0
7EC 27 00 5A 15 99 41 01 84
7EC 28 00 00 00 00 03 E8 00
2105
7EC 10 2C 61 05 FF FF FF FF
7EC 21 00 00 00 00 00 0C 0C
7EC 22 0E 00 00 00 00 17 DD
7EC 23 23 28 00 01 64 0E 0E
7EC 24 00 62 02 00 54 08 B7
7EC 25 00 00 00 00 00 00 00
7EC 26 00 00 00 00 00 00 00

2015-11-19 04:44:10
2101
7EC 10 3D 61 01 FF FF FF FF
7EC 21 AE 17 DD 23 28 A3 FF
7EC 22 DA 0F 55 0E 0C 0E 0C
7EC 23 0C 0B 0C 00 0F CC 2A
7EC 24 CC 0C 00 00 82 00 01
7EC 25 65 92 00 01 60 D6 00
7EC 26 00 83 B6 00 00 7E A0
7EC 27 00 5A 15 A2 41 01 85
7EC 28 00 00 00 00 03 E8 00
2105
7EC 10 2C 61 05 FF FF FF FF
7EC 21 00 00 00 00 00 0C 0C
7EC 22 0E 00 00 00 00 17 DD
7EC 23 23 28 00 01 64 0E 0E
7EC 24 00 67 18 00 5C 01 B7
7EC 25 00 00 00 00 00 00 00
7EC 26 00 00 00 00 00 00 00
 
JejuSoul said:
The Cumulative Energy Charged data increased by 50kWh
The Cumulative Energy Discharged data increased by 48kWh
What is the reason for this disparity 35 / 34 contrasted with 50 / 48
I am also confused about the Cumulative counters. I have assumed they were originating from the BMS (inside the battery pack), but after analyzing the logged data from an L3 QC charging session, I'm not so sure. After 20 min or so I turned on the heater while charging was in progress. The log shows that the Cumulative Discharge counter started to count up, while still 20kW power was going in to the battery. During the last 10 minutes of charging (to 83%) 1.2kWh was consumed. This points in the direction that some external device is involved in measuring the energy. The battery itself should only see the net current going in or out. But wait a minute - 1.2 kWh during 10m means 7kW of power, and no way the heater system was consuming that much...
So what do we really *know* about these numbers?
 
Elmil: thanks for the updated data. Here's the latest graph. We only have 3 cars with at least 3 data points.
The pink dots are my car, the yellow yours, and the blue is from Canada.
As you can see yours and mine form straight lines, but the Canadian car does not.
It is a rental car and will probably be returned soon.
Leaving that odd data in the plot though does help show that we don't really know what is going on yet.
169gwh4.jpg


The comparison below is between my car and yours. Both are about 7 months old.
By the end of October you had driven 18000km and I had driven 7000km.
The OBD data starts then. It is the last 4 weeks of driving that I compare.
We have both driven about 1700km in the last 4 weeks. (You are driving less than before?)
We both have a Cumulative Energy Discharged figure of about 400kWh for that 4 week period.
This gives an average efficiency for both of us 23.5 kWh / 100km. In reality I got about 13 kWh / 100km this month. (You?)
But my Cumulative Operating Time is about 100 hours whereas yours is 200 hours for the 4 weeks.
My time is 50% driving and 50% charging. I usually use L2 6.6kWh and occasionally QC. Never L1.
You must either have a 3.3kWh L2 or using L1 frequently (true?)
Your deterioration values at 10.3/9.2% increased by 1.0/0.9% over the period.
My deterioration values at 3.5/0.1% increased by 1.0/0.0% over the period.
It is the big difference in minimum deterioration value that explains the different slopes in the graph above.
Why this should be I don't know.
 
JejuSoul said:
The comparison below is between my car and yours. Both are about 7 months old.
By the end of October you had driven 18000km and I had driven 7000km.
The OBD data starts then. It is the last 4 weeks of driving that I compare.
We have both driven about 1700km in the last 4 weeks. (You are driving less than before?)
Not as much as during summer, but still at least 500km/week

We both have a Cumulative Energy Discharged figure of about 400kWh for that 4 week period.
This gives an average efficiency for both of us 23.5 kWh / 100km. In reality I got about 13 kWh / 100km this month. (You?)
I don't keep records of the displayed consumption, but these weeks probably are around 16-17kWh/100km. It's been below 0C many days lately.

But my Cumulative Operating Time is about 100 hours whereas yours is 200 hours for the 4 weeks.
My time is 50% driving and 50% charging. I usually use L2 6.6kWh and occasionally QC. Never L1.
You must either have a 3.3kWh L2 or using L1 frequently (true?)
I always charge over night using the Kia provided EVSE cable, which delivers up to 1.6kW to the battery. Sometimes QC but sparely.
Your deterioration values at 10.3/9.2% increased by 1.0/0.9% over the period.
My deterioration values at 3.5/0.1% increased by 1.0/0.0% over the period.
It is the big difference in minimum deterioration value that explains the different slopes in the graph above.
Why this should be I don't know.
 
I have added a tab in the "Kia Soul EV CAN Messages" spreadsheet with data from a CHAdeMO charging session I did yesterday. Exactly the same thing happened as did at another QC a few days ago. I.e during the last 5-10 minutes until completion (83%), the Accumulative Discharge Energy counter started to count. This time it did 1.5kWh in 8 minutes. I am speculating that it might be due to cell balancing, but the power (11kW) seems too high. Any thoughts??
 
Hi Elmil, that is interesting data. I cannot explain it.
There is an interesting discussion of Chademo at the the German site here (in English)
http://www.goingelectric.de/forum/kia-soul-ev/ovms-fuer-den-soul-t9741-120.html
I added a comment about you data.
Hope they have some ideas.
 
Jejusoul, can recuperation be the cause of the differences you see in your numbers?
If your car produced 14-15kWh in recuperation during driving, this would add up:

Cumulative energy charged: 35 from charging + 15 from recuperation = 50kWh
Cumulative energy discharged: 34 actually used "from battery" + 15 of the recuperated enegry = 49kWh.

This might also explain why the cumulative discharge/odometer is so high on my car: 21.62kWh/100km.
 
goev said:
Jejusoul, can recuperation be the cause of the differences you see in your numbers?
Interesting idea.
The Cumulative Energy counters are too high. Recuperation may explain it.
I will try to measure this by recording data coming down the mountain.

I have the same inconsistency as you in that the cumulative discharge/odometer reading does not match my trip reality.
I plotted it out to check : Only 1 month of data so no climate variation to view yet.
2cnw4ub.jpg

The graph shows 21kWh/100km, my reality is between 13 and 14 kWh/100km.
 
Elmil said:
I have added a tab in the "Kia Soul EV CAN Messages" spreadsheet with data from a CHAdeMO charging session I did yesterday. Exactly the same thing happened as did at another QC a few days ago. I.e during the last 5-10 minutes until completion (83%), the Accumulative Discharge Energy counter started to count. This time it did 1.5kWh in 8 minutes. I am speculating that it might be due to cell balancing, but the power (11kW) seems too high. Any thoughts??
I logged a Chademo session today. The Accumulative Discharge Energy counter did not change. The 96 cells were not balanced beforehand, but after charging I had a completely balanced pack for the first time since I have been recording data,
 
I recorded a Chademo session again today. Some comments.
1. The Cumulative Energy Charged counter had increased between charges.
2. The efficiency of the charging seems to be about 94%
3. Again I did not see the Cumulative Energy Discharged counter alter during the charge.

It seems the Cumulative Energy counters do include the recuperation energy created during braking.
This renders the charts I have made for comparing cars useless, because driving style means each car will have a different proportion of recuperation.
The only good news is that for my own car the slope of the deterioration is a lot less than before.
I can't judge for any other car because I don't have the data.
 
I recorded another CHAdeMO session this weekend, with same result as before. Cumulative Energy Discharged counter started moving at the same level.

Today I found another anomaly, this time with the Cumulative Energy Charged counter...

- Recorded the drive to work all the way until shutdown of the car.
- Car parked all day (9+ hours) without any charging cable connected. Temperature 0C all day.
- First logged record after starting the car (still parked and unconnected) shows that the Cumulative Energy Charged counter had moved 0.4kWh during the day!

Which means that the battery was charged with 40W from nowhere, during all day....

Possible explanations:
- The BMC had buffered data still not accounted for when I turned off the car?
- The BMC made some sort of compensation after all load was removed and the battery voltage was allowed to float?
- Another cell balancing symptom?
- ?

It's pretty obvious in my logs that the Cumulative Energy Charged counter includes the recuperation energy, which is logical.
But there seem to be enough anomalies to be restrictive with interpretations of these numbers, as well as the deterioration values.
I will continue recording and we'll see if any pattern shows up. ;)
 
After not changing for 1500km my deterioration counters suddenly jumped yesterday.
I have driven 9800km in 7 months.
Before Yesterday: max 3.5% min 0.1%
Yesterday morning: max 4.5% min 4.4%
Yesterday evening: max 5.5 min 4.4%
I assume this is a calibration effect rather than something I did yesterday that caused deterioration to happen suddenly.
Whatever these numbers mean my car is now fairly similar in rate of deterioration to yours.

Yesterday I drove over the mountain on the fast road to record recuperation effect.
I drove 49km using 7.2kWh off the battery and recuperated 2.6kWh.
For this trip I got 27% of the energy from recuperation.

My car has a driving info screen under the UVO settings. I don't know if any of you have this function. Here is the display.
22591


I also posted this message on the German forum under the OVMS thread. That thread is quite busy and useful. http://www.goingelectric.de/forum/kia-soul-ev/ovms-fuer-den-soul-t9741-130.html
 
Elmil said:
.... I.e during the last 5-10 minutes until completion (83%), ..... This time it did 1.5kWh in 8 minutes. I am speculating that it might be due to cell balancing, but the power (11kW) seems too high. Any thoughts??

This happens with my KIA all the time.
Needs from 80.9% to arround 83.0% arround 15 to 20 minutes (at all EVTEC 20KW station and the charger goes down until 2.2kW sometimes).
Charges easily 1.5kWh per percent (sometimes it is more in the 81%, sometimes more in the 82% range).
AND
At a 50kW ABB Tera station it will go only half the time and only goes down until arround 9 to 11kW.
I do not know if the longer time is a fault from the charger or not.
 
Tom said:
This happens with my KIA all the time...
What Elmil is referring to is the Cumulative Energy Discharged counter in the battery management system of the car itself. This counter goes up during the last portion of the charge. To graph battery ageing I use the Cumulative Energy numbers because I assume the deterioration is proportional to the use. That the numbers also include regeneration energy is fine, since this energy also counts as use. But am not sure if the increase Elmil has seen also counts as use. For now I'll ignore it and continue to graph data using the Cumulative Energy Discharged counter. Let's see if the graphs make sense when we compare them with actual range deterioration data. We don't have any yet - that's a future task - perhaps in two years time.

Some data we do have is the U.S. Advanced Vehicle Testing Activity from Phoenix, Arizona.
Phoenix is very hot. It is known to cause faster deterioration. (Especially to cars without thermal management of the battery = leaf)
None of the data we have for our Soul EVs is from a place as hot as Phoenix.
But that is where the testing center is and that is the data we've got.

sgmyj7.jpg


The trend lines are for the:
Ford Focus - 10% deterioration in 1 year driving 1000 miles a month.
2013 Leaf - 20% deterioration in 1 year driving 1000 miles a month.

The BMW seems to be on the same line as the Focus. (not enough data to make a trend yet)
Our data seems to be closer to the Focus than the Leaf. (but we don't know what scale our data is at yet)
 
Back
Top