Reading around forums for other EVs, folks are posting DCFC graphs for their cars. These are super useful for road trips when you want to maximize your charging rate (and minimize your charging time and per minute cost). I don't think there exists any for the Soul EV, so I went ahead and collected some data. The data was collected on Torque Pro using Jeju's Soul EV PIDs.
The DCFC session was performed on a standard 50kW (125A) CHAdeMO charger. The charging session was from 8% to 94% until it shut off automatically, as the Soul EV has a hard cut off at 94%. I was mindful of others waiting to use the charger as the 10% or so takes a very long time (there wasn't anyone). The ambient temperature was 50F as reported by the car, and it's possible that the colder temps helped maintain charging rate vs. in a hotter summer climate. Anyway, here are the juicy details!
For all the charts below, I've embedded a static Image for quick viewing and a link to an interactive graph. Following the link you'll be able to hover over the data to get exact values for the curve. (At least on a computer, not sure on mobile)
Interactive chart, SoC vs Power
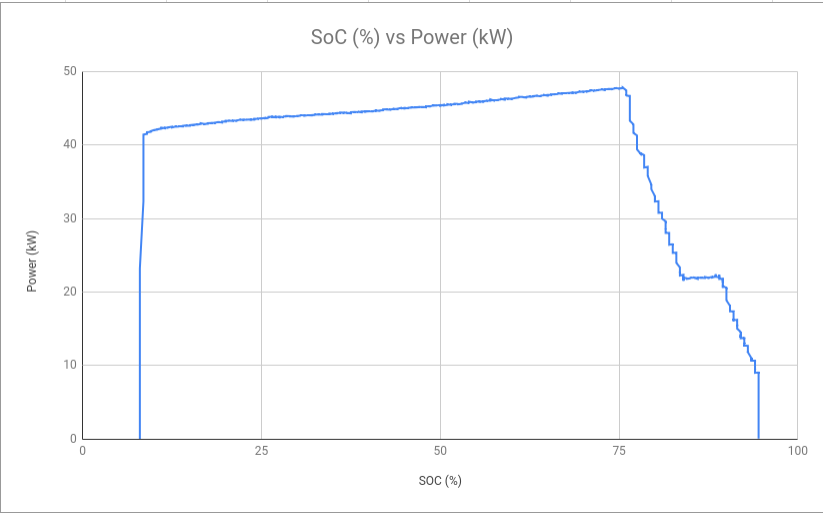
Charging power starts at 8%/40kW and gradually rises to its peak at 75.5%/47.8kW. It then quickly ramps down to 22kW from 76% to 84%. It stays at 22kW from 84% to 90%. It then quickly ramps down to 9kW from 90% to 94.5%, at which point it shuts off. Just based on this, it's clear that we should disconnect and move on at around 76% or so. But if not, definitely leave at 90% as there's absolutely no point in charging at less than 22kW.
Interactive chart, SoC vs Volts/Amps
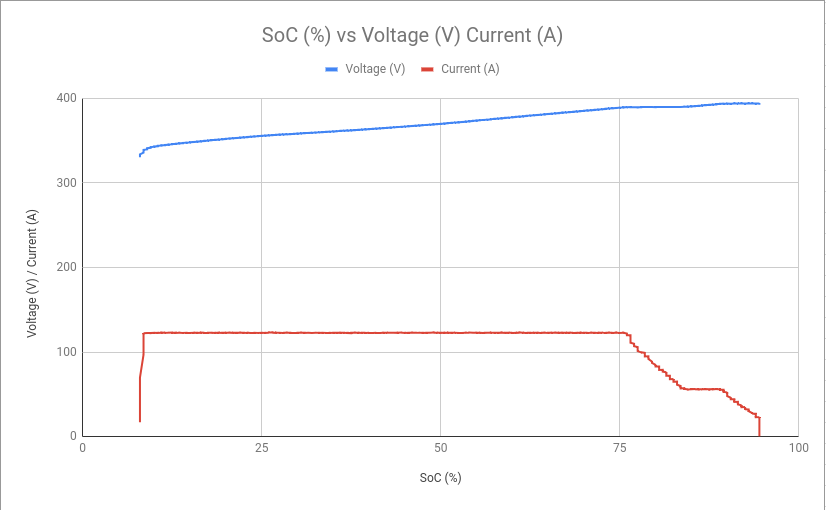
Voltage starts from 8%/330.5V and gradually rises to 94.5%/394.1V.
Current quickly ramps up to 122.4A at 8%. It maxes out at 122.9A from 10% to 75.5%. It then quickly ramps down to 55A from 76% to 84%. It stays at 55A from 84% to 90%. It then quickly ramps down to 23.1A from 90% to 94.5%, at which point it shuts off.
Interactive chart, SoC vs Battery Temp/Fan State
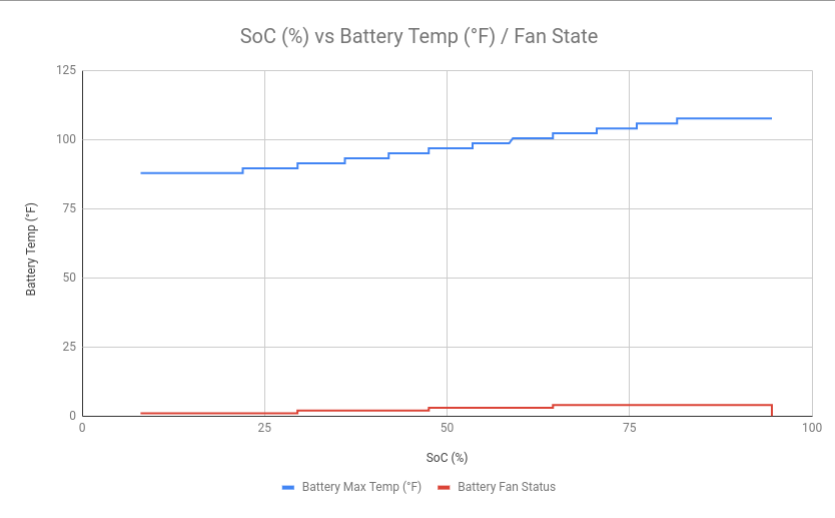
The battery temperature starts off at 8%/87F and gradually rises to 94.5%/107.6F.
The battery cooling fan starts at 8%/level 1 and gradually steps up to 94.5%/level 4.
The battery gets hot as expected due to the DCFC, but the fan kicks on to help compensate at least a little bit. One data point not shown here is the battery inlet temperature (cabin temp) which was fairly constant at 64F (in raw data below). The battery cooling fan sucks in cabin air to cool the battery.
Interactive chart, Charging time vs SoC Display / SoC BMS
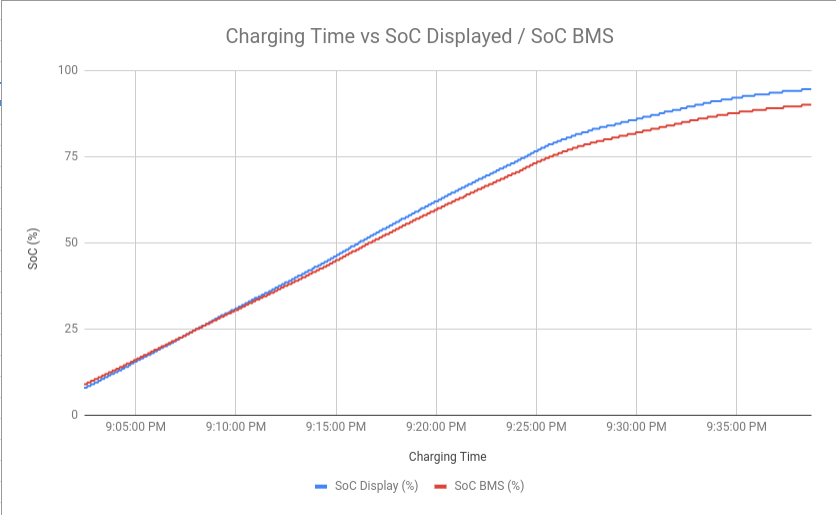
This is an interesting one. The SoC displayed to the user doesn't correspond to the actual SoC that the BMS knows. When I started charging at 8% SoC displayed, the BMS was actually at 9% (showing that there's a buffer at the bottom, hidden from the user). When charging finished at 94.5% SoC displayed, the BMS was actually at 90% (showing that there's a buffer at the top too).
Interactive chart, Charging time vs SoC / Available Energy
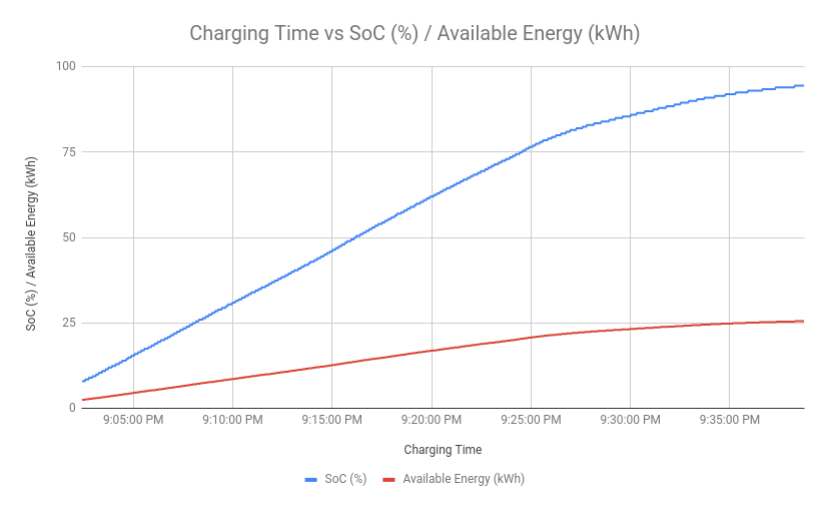
This is probably the most useful chart. We can see that the rate that the SoC rises is not linear with time and exponentially slows down after 77% or so. Same thing for available energy: by 77%, we already have charged up to 21 kWh in our car (in 23 minutes of charging) and adding in that last 4.38 kWh to 94% takes 13 mins!
If anyone wants the raw data, it's here in this Google Spreadsheet in CSV format. Enjoy!
Oh and in case anyone's wondering how much this whole experiment cost:
1) The DCFC was billed at $0.20 per minute. I charged for 36m18s costing me $7.20 total.
2) i charged up a total of 21.869 kWh from 8%->94%
Thus it ended up costing me $0.33 / kWh. If I had left at 77%, it would have cost me $4.60 for 18.44 kWh, or $0.249 / kWh, very reasonable in CA.
The DCFC session was performed on a standard 50kW (125A) CHAdeMO charger. The charging session was from 8% to 94% until it shut off automatically, as the Soul EV has a hard cut off at 94%. I was mindful of others waiting to use the charger as the 10% or so takes a very long time (there wasn't anyone). The ambient temperature was 50F as reported by the car, and it's possible that the colder temps helped maintain charging rate vs. in a hotter summer climate. Anyway, here are the juicy details!
For all the charts below, I've embedded a static Image for quick viewing and a link to an interactive graph. Following the link you'll be able to hover over the data to get exact values for the curve. (At least on a computer, not sure on mobile)
Interactive chart, SoC vs Power

Charging power starts at 8%/40kW and gradually rises to its peak at 75.5%/47.8kW. It then quickly ramps down to 22kW from 76% to 84%. It stays at 22kW from 84% to 90%. It then quickly ramps down to 9kW from 90% to 94.5%, at which point it shuts off. Just based on this, it's clear that we should disconnect and move on at around 76% or so. But if not, definitely leave at 90% as there's absolutely no point in charging at less than 22kW.
Interactive chart, SoC vs Volts/Amps

Voltage starts from 8%/330.5V and gradually rises to 94.5%/394.1V.
Current quickly ramps up to 122.4A at 8%. It maxes out at 122.9A from 10% to 75.5%. It then quickly ramps down to 55A from 76% to 84%. It stays at 55A from 84% to 90%. It then quickly ramps down to 23.1A from 90% to 94.5%, at which point it shuts off.
Interactive chart, SoC vs Battery Temp/Fan State

The battery temperature starts off at 8%/87F and gradually rises to 94.5%/107.6F.
The battery cooling fan starts at 8%/level 1 and gradually steps up to 94.5%/level 4.
The battery gets hot as expected due to the DCFC, but the fan kicks on to help compensate at least a little bit. One data point not shown here is the battery inlet temperature (cabin temp) which was fairly constant at 64F (in raw data below). The battery cooling fan sucks in cabin air to cool the battery.
Interactive chart, Charging time vs SoC Display / SoC BMS

This is an interesting one. The SoC displayed to the user doesn't correspond to the actual SoC that the BMS knows. When I started charging at 8% SoC displayed, the BMS was actually at 9% (showing that there's a buffer at the bottom, hidden from the user). When charging finished at 94.5% SoC displayed, the BMS was actually at 90% (showing that there's a buffer at the top too).
Interactive chart, Charging time vs SoC / Available Energy

This is probably the most useful chart. We can see that the rate that the SoC rises is not linear with time and exponentially slows down after 77% or so. Same thing for available energy: by 77%, we already have charged up to 21 kWh in our car (in 23 minutes of charging) and adding in that last 4.38 kWh to 94% takes 13 mins!
If anyone wants the raw data, it's here in this Google Spreadsheet in CSV format. Enjoy!
Oh and in case anyone's wondering how much this whole experiment cost:
1) The DCFC was billed at $0.20 per minute. I charged for 36m18s costing me $7.20 total.
2) i charged up a total of 21.869 kWh from 8%->94%
Thus it ended up costing me $0.33 / kWh. If I had left at 77%, it would have cost me $4.60 for 18.44 kWh, or $0.249 / kWh, very reasonable in CA.


